Create Scientific Graphs with KaleidaGraph

Communicate your findings clearly and convincingly with KaleidaGraph!
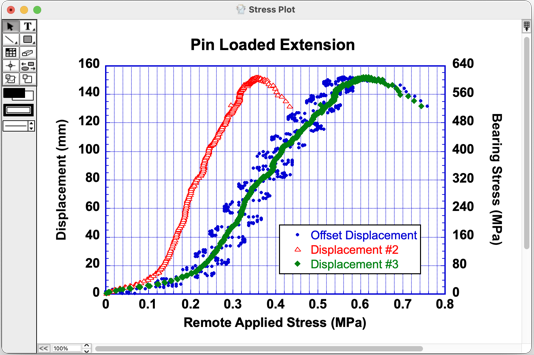
KaleidaGraph is the scientist’s choice for graphing and data analysis. This unique application distinguishes itself in the technical marketplace with its powerful curve fitting, precise plot customization, helpful stats, short learning curve, and affordable price. You can easily import, analyze, and manipulate data, then produce publication-quality output for a variety of applications.
And since our licenses are perpetual, there is no yearly subscription fee. The only cost in the future would be to optionally buy upgrades when they become available.
Try KaleidaGraph today!
Create your own plots using our FREE 30-day trial version.
KaleidaGraph Graph Types
Data has long been a major part of any scientific process. Scientists in different fields collect data in many different forms during their experiments. Although data is initially entered in tables or databases, it is eventually displayed in a graphic form to help visualize and interpret the trends within the data. KaleidaGraph provides over 25 different plot types to help scientists graph, explore, and learn from their data.
Line and Scatter Plots
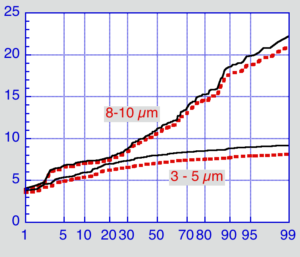
Line, Scatter, Double X, Double Y, Double XY, High/Low, Step, Fill, and Bubble.


Bar and Column Plots
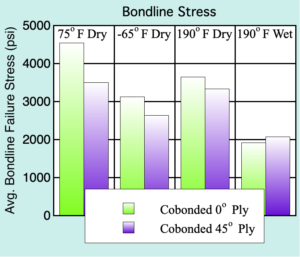
Horizontal Bar, Stack Bar, Column, Stack Column, Double Y Bar, Double Y Column, Floating Bar, and Floating Column.


Statistical Plots
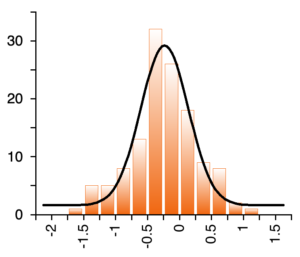
Probability, X-Y Probability, Histogram, Box, Percentile, Dot, and Summary Column.


Other Types of Plots
Polar, Pie, and Function.


Meeting the needs of scientists and engineers for over 35 years.
See what one of our long-time customers has to say:
I started using KaleidaGraph about 30 years ago, as a much welcome upgrade to the venerable Cricket Graph, which I had used on an old MacPlus since 1986 - maybe started with KaleidaGraph when I got a Mac II with color monitor, although details not so clear as it was a long time ago. Since then I have introduced it to numerous PhD, Masters, and undergrad students, so have hopefully contributed somewhat to your growth. My first intervention was always to point out, when someone presented me with a horrible Excel 'chart', that it would really be much wiser to do such things with KaleidaGraph - nobody ever told me I was wrong about this! Best wishes for the future.
