An organizational chart template in PowerPoint is a graphical representation of a company's structure, hierarchy, and reporting relationships. It serves as a visual tool that helps to depict the different departments, positions, and individuals within an organization. The primary purpose of an organizational chart template in PowerPoint is to present a clear and concise overview of the organization's structure. This enables employees, stakeholders, and other individuals to understand how the organization operates and the roles and responsibilities of each department or individual. The template utilizes various shapes, lines, and text to clearly illustrate the reporting lines, communication channels, and levels of authority within the organization. PowerPoint offers multiple types of organizational chart templates, each suitable for different purposes and requirements. Some commonly used organizational chart templates include: 1. Hierarchical Organizational Chart: This type of template represents the organization's structure from top to bottom, showcasing the chain of command, reporting relationships, and levels of authority. It is structured in a pyramid-like format, with the CEO or the highest-ranking position at the top, followed by various levels of management, departments, and employees. 2. Matrix Organizational Chart: A matrix organizational chart template is used to depict the relationships between different teams, departments, and individuals in a matrix structure. It is suitable for organizations with cross-functional teams or projects, where employees report to both functional managers and project managers. 3. Departmental Organizational Chart: This template focuses on displaying the various departments within an organization and their corresponding positions. It highlights the relationships between different departments, helping to visualize the division of responsibilities and coordination between teams. 4. Flat Organizational Chart: A flat organizational chart template emphasizes the collaborative nature of the organization and the absence of strict hierarchical levels. It showcases a horizontal structure, where employees have a more equal level of authority and decision-making power. 5. Circular Organizational Chart: This template represents the organization's structure in a circular layout, with the top-level position at the center. It provides a unique visual representation of the organization's hierarchy, allowing for easy identification of roles and reporting relationships. Overall, an organizational chart template in PowerPoint is an essential tool for visually organizing and communicating the structure and relationships within an organization. By utilizing different types of templates based on the specific requirements, organizations can effectively present complex information in a clear and understandable format.
Organizational Chart Template In Powerpoint
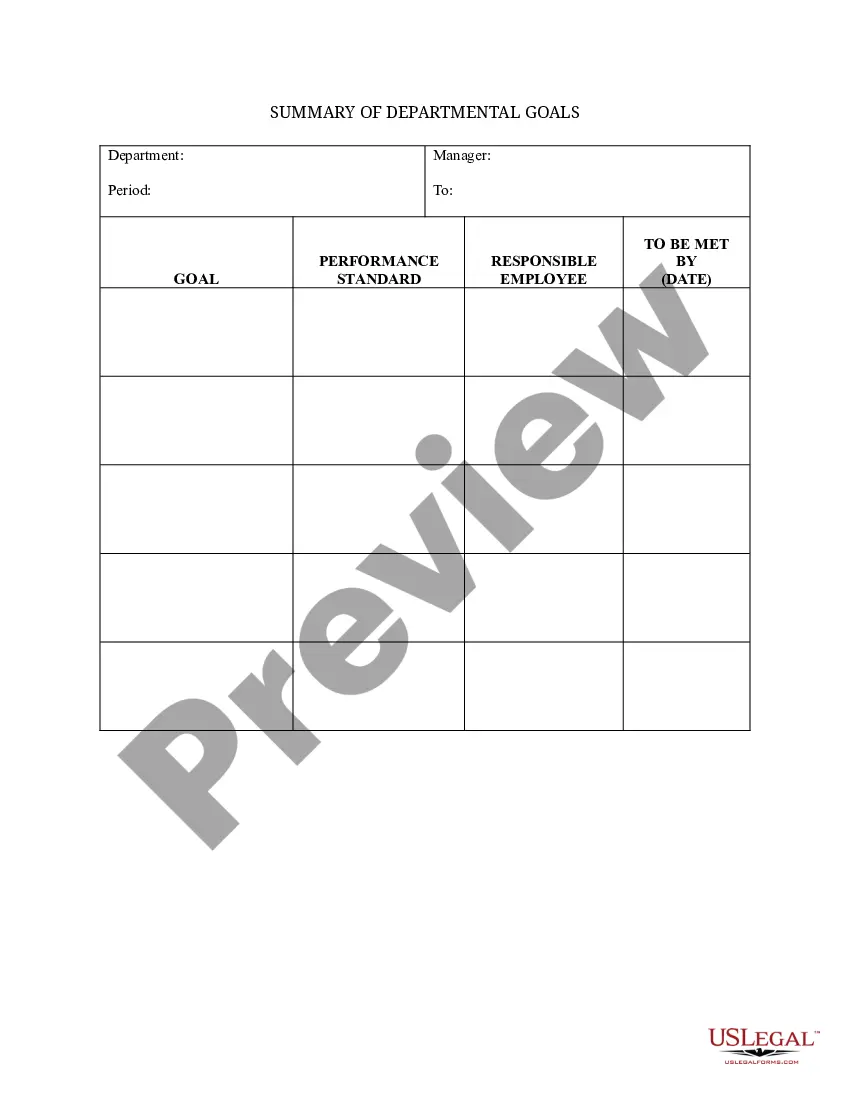
Description Employee Chart Template
How to fill out Goals Employee Online?
Whether for business purposes or for individual affairs, everyone has to manage legal situations sooner or later in their life. Completing legal paperwork demands careful attention, beginning from selecting the proper form template. For instance, when you choose a wrong version of the Organizational Chart Template In Powerpoint, it will be turned down when you send it. It is therefore crucial to get a dependable source of legal files like US Legal Forms.
If you have to get a Organizational Chart Template In Powerpoint template, follow these easy steps:
- Find the sample you need by utilizing the search field or catalog navigation.
- Look through the form’s information to ensure it suits your case, state, and region.
- Click on the form’s preview to see it.
- If it is the wrong document, get back to the search function to find the Organizational Chart Template In Powerpoint sample you need.
- Get the template when it meets your needs.
- If you have a US Legal Forms account, simply click Log in to gain access to previously saved templates in My Forms.
- If you don’t have an account yet, you can obtain the form by clicking Buy now.
- Select the proper pricing option.
- Complete the account registration form.
- Select your transaction method: use a bank card or PayPal account.
- Select the document format you want and download the Organizational Chart Template In Powerpoint.
- When it is saved, you can fill out the form with the help of editing software or print it and complete it manually.
With a substantial US Legal Forms catalog at hand, you never have to spend time seeking for the right sample across the internet. Utilize the library’s straightforward navigation to find the proper template for any situation.