Get the free pie chart template form
Show details
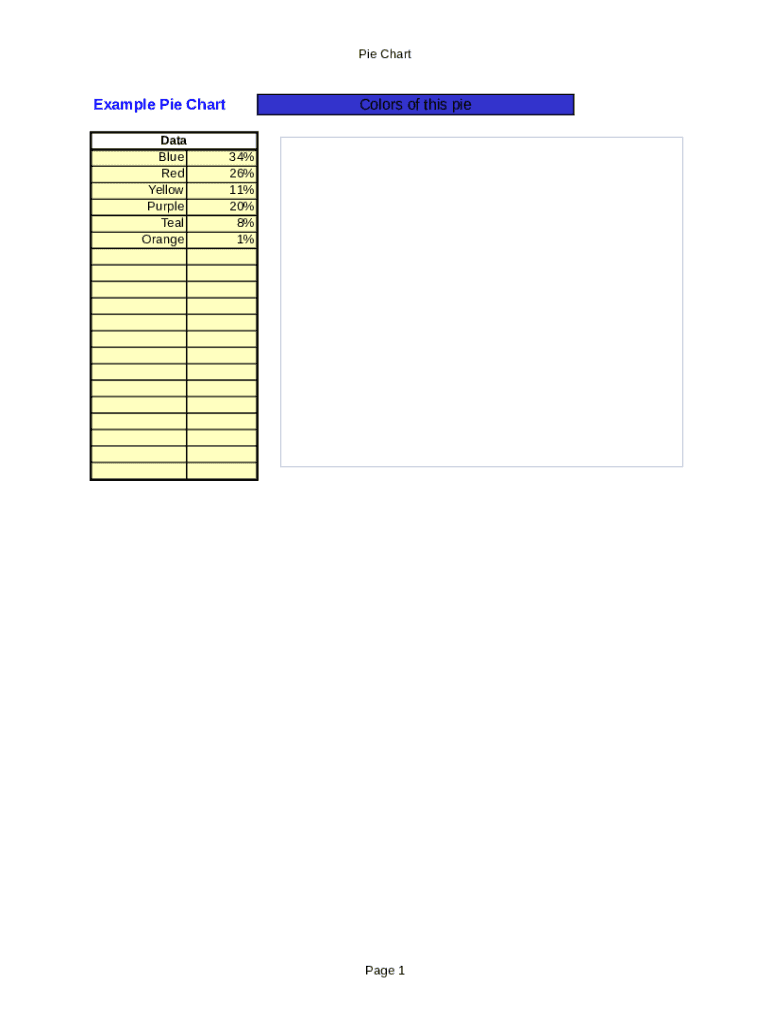
Pie charts can represent all things in life that are made up of at least two parts. Use this Colorful Pie Chart Template to graph something in the most wonderful aesthetic ever.
We are not affiliated with any brand or entity on this form
Get, Create, Make and Sign
Edit your pie chart template form form online
Type text, complete fillable fields, insert images, highlight or blackout data for discretion, add comments, and more.

Add your legally-binding signature
Draw or type your signature, upload a signature image, or capture it with your digital camera.
Share your form instantly
Email, fax, or share your pie chart template form form via URL. You can also download, print, or export forms to your preferred cloud storage service.
Editing pie chart template online


Follow the guidelines below to benefit from the PDF editor's expertise:
1
Log in to account. Start Free Trial and sign up a profile if you don't have one yet.
2
Upload a document. Select Add New on your Dashboard and transfer a file into the system in one of the following ways: by uploading it from your device or importing from the cloud, web, or internal mail. Then, click Start editing.
3
Edit pie chart template excel form. Rearrange and rotate pages, insert new and alter existing texts, add new objects, and take advantage of other helpful tools. Click Done to apply changes and return to your Dashboard. Go to the Documents tab to access merging, splitting, locking, or unlocking functions.
4
Save your file. Choose it from the list of records. Then, shift the pointer to the right toolbar and select one of the several exporting methods: save it in multiple formats, download it as a PDF, email it, or save it to the cloud.
pdfFiller makes working with documents easier than you could ever imagine. Create an account to find out for yourself how it works!
How to fill out pie chart template form

How to fill out pie chart template:
01
Start by determining the categories or data points that you want to represent in the pie chart. This could include different options or variables that you want to compare or highlight.
02
Assign each category or data point a specific value or percentage that represents its proportion in relation to the whole. Make sure that all the values add up to 100% to accurately represent the entire data set.
03
Use a pie chart template or software to insert the categories and their corresponding values. This can be done by inputting the data directly into the template or using a charting tool to create a visual representation based on your data.
04
Customize the appearance of the pie chart by selecting different colors or patterns for each category. This can help differentiate the segments and make the chart more visually appealing and engaging.
05
Include a title and clear labels for each category in the chart. This will provide additional context and make it easier for viewers to understand the data being presented.
Who needs pie chart template:
01
Students and educators: Pie charts can be useful tools for teaching and learning about data visualization and analysis. They can be used in classrooms to illustrate concepts such as percentages, proportions, and comparisons.
02
Business professionals: Pie charts are commonly used in business presentations and reports to convey information in a visually appealing and easily understandable manner. They can be used to showcase market share, sales data, budget allocations, and more.
03
Researchers and analysts: Pie charts can be valuable tools for visualizing data in research studies and data analysis. They can provide a quick and intuitive way to communicate findings and patterns in a concise manner.
Fill doughnuts pie chart excel download : Try Risk Free
For pdfFiller’s FAQs
Below is a list of the most common customer questions. If you can’t find an answer to your question, please don’t hesitate to reach out to us.
What is pie chart template?
A pie chart template is a pre-designed graphical representation of data in the form of a circular chart, divided into sectors that represent different categories or data points. It provides a visual way to illustrate data proportions and show the relationship between different components of a whole. A pie chart template typically includes placeholders or options to input data values and labels for each sector, along with customizable colors, labels, and other design elements.
Who is required to file pie chart template?
The person or organization responsible for creating and presenting a pie chart is the one required to file a pie chart template. This can vary depending on the context and purpose of the chart. For example, if a company is preparing financial reports, the person or team in charge of financial analysis may be in charge of creating and filing the pie chart template. Similarly, if a government agency is collecting and analyzing data, the responsible department or individual would be required to file the pie chart template.
How to fill out pie chart template?
To fill out a pie chart template, follow these steps:
1. Determine the data categories: Identify the different categories or groups you want to represent in the pie chart. For example, if you are creating a pie chart to represent a company's sales by region, your data categories could be "North America," "Europe," "Asia," and "Other."
2. Determine the values or proportions: Assign a numerical value to each category that represents its proportion or percentage of the whole. These values should add up to 100% since a pie chart represents a whole circle. You can use percentages or decimal fractions for this step.
3. Calculate the angles: To convert the proportions into angles, multiply each proportion by 360° (the total number of degrees in a circle). For example, if "North America" represents 30% of sales, the angle would be 30% x 360° = 108°.
4. Draw the pie chart: Use the template to draw a circle representing the whole, and then divide it into sectors based on the calculated angles for each category. You can label each sector with the category name and its corresponding percentage or value.
5. Color the sectors: Add colors to each sector to make the pie chart visually appealing and easier to distinguish between categories. Ensure that each color is consistent with the category it represents. Adding a legend can also be helpful, especially if there are many categories.
6. Review and adjust: Double-check your calculations and proportions to ensure accuracy. Make any necessary adjustments or corrections before finalizing the chart.
7. Interpret and communicate: Once you have completed the pie chart, analyze it to identify patterns or trends. You can use this chart to present data in a visual format that is easy to understand and communicate insights to others.
What is the purpose of pie chart template?
The purpose of a pie chart template is to provide a visual representation of data in the form of a circular chart, divided into different sectors that represent different categories or proportions of a whole. It allows for easy and quick interpretation and comparison of data, making it useful for presentations, reports, and data analysis. The template provides a framework for organizing and presenting data in a pie chart format, saving time and effort in creating a chart from scratch.
What information must be reported on pie chart template?
The information that must be reported on a pie chart template includes:
1. Title: The chart should have a clear and concise title that describes the main topic or focus of the data being presented.
2. Data Categories: Each category or segment of the pie chart should be labeled with a specific name or description. For example, if the chart represents different types of fruits, the categories could be "Apples," "Oranges," "Bananas," etc.
3. Values or Percentages: Each category in the pie chart should be assigned a corresponding value or percentage that represents its proportion or share of the total. This information can be displayed either within or next to each segment of the pie.
4. Legend: A legend may be included in the template to explain the colors or patterns used to represent each category. It helps viewers understand which color corresponds to which category, especially when there are multiple segments.
5. Source: It is important to include the source of the data used to create the pie chart, especially if it is from a specific study, survey, or research report. This allows viewers to assess the credibility and reliability of the information.
Additionally, it is essential to ensure that the pie chart is visually clear and easy to read. The segments should be proportional to their respective values and represented accurately, without any distortion or misleading visual cues. The chart should also have appropriate labels, including a title, legends, and axis labels (if applicable), to help viewers understand the data being presented.
What is the penalty for the late filing of pie chart template?
There is no specific penalty for the late filing of a pie chart template as it is not a legal or regulatory document that requires filing. A pie chart is a graphical representation of data and is typically used to present information in a visual format. The deadlines for using or submitting a pie chart template will vary depending on the purpose or requirement set by the organization or individuals involved. However, if a pie chart is required for a specific deadline or project, failing to submit it on time may result in delays, missed opportunities, or a negative impact on the project or decision-making process.
How can I modify pie chart template without leaving Google Drive?
People who need to keep track of documents and fill out forms quickly can connect PDF Filler to their Google Docs account. This means that they can make, edit, and sign documents right from their Google Drive. Make your pie chart template excel form into a fillable form that you can manage and sign from any internet-connected device with this add-on.
How can I get pie template excel?
The premium pdfFiller subscription gives you access to over 25M fillable templates that you can download, fill out, print, and sign. The library has state-specific make a pie chart and other forms. Find the template you need and change it using powerful tools.
How do I make edits in pie template sheet without leaving Chrome?
chart template document form can be edited, filled out, and signed with the pdfFiller Google Chrome Extension. You can open the editor right from a Google search page with just one click. Fillable documents can be done on any web-connected device without leaving Chrome.
Fill out your pie chart template form online with pdfFiller!
pdfFiller is an end-to-end solution for managing, creating, and editing documents and forms in the cloud. Save time and hassle by preparing your tax forms online.
Pie Template Excel is not the form you're looking for?Search for another form here.
Keywords relevant to pie template form
Related to colorful chart template


If you believe that this page should be taken down, please follow our DMCA take down process
here
.
